Free MCAT study note
Demographic Transition Model: The 5 Stages Explained for the MCAT
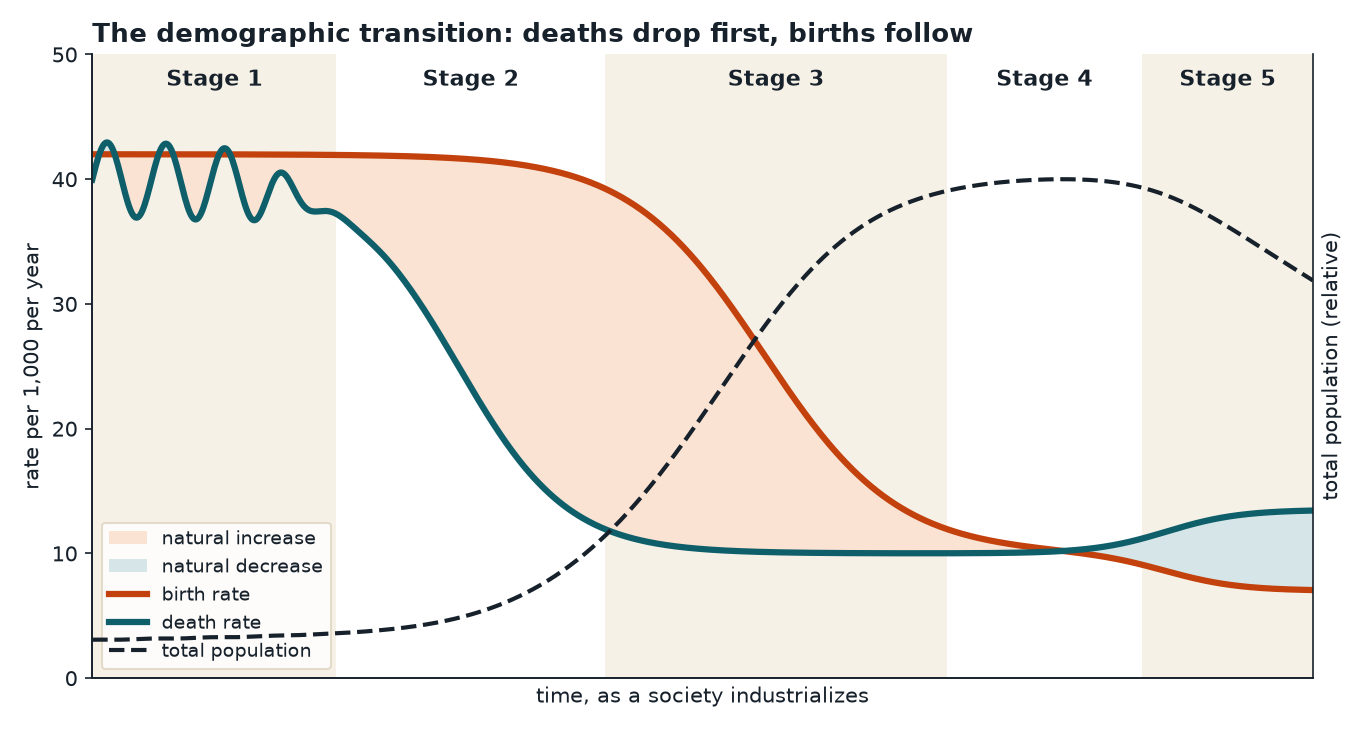
The demographic transition model describes how a society's birth and death rates change as it industrializes. It starts with high birth and death rates and slow growth (Stage 1), moves through a phase where death rates fall first and the population grows quickly (Stage 2), then a phase where birth rates fall and growth slows (Stage 3), and ends with low birth and death rates and little growth (Stage 4). Many modern descriptions add a Stage 5, where births drop below deaths and the population shrinks and ages. The key idea is the lag: death rates fall before birth rates do, and the gap between them is when populations boom.
The two rates that drive the model
The model tracks two numbers, both counted per 1,000 people per year:
- Crude birth rate (CBR): live births per 1,000 people per year.
- Crude death rate (CDR): deaths per 1,000 people per year.
The difference between them is the rate of natural increase (RNI). It ignores migration, which is why it is called "natural":
RNI (%) = (CBR − CDR) / 10
Dividing by 10 converts "per 1,000" into a percent. A country with 30 births and 10 deaths per 1,000 grows by 20 per 1,000, or 2.0% per year.
These rates are "crude" because they do not adjust for age structure. A country full of retirees can have a high crude death rate even if its health care is excellent, a point that matters in Stage 5.
Stage by stage
Stage 1: high stationary
- Birth rate: high. Children contribute farm and household labor, many die young, and contraception is limited.
- Death rate: high and fluctuating. Famine, epidemics and poor sanitation keep mortality up, with spikes in bad years.
- Growth: slow and unsteady, because births and deaths roughly cancel.
- Today: no country is in Stage 1; it describes pre-industrial societies.
Stage 2: early expanding
- Death rate: falls sharply. Better food supply, clean water, sanitation and later vaccines and antibiotics cut mortality, especially among infants and children.
- Birth rate: stays high. Fertility depends on cultural norms, family economics and access to contraception, and those change more slowly than survival does.
- Growth: rapid. This is the population explosion.
- Population pyramid: a wide base that narrows quickly, an expansive pyramid dominated by children.
Stage 3: late expanding
- Birth rate: falls. Common drivers are urbanization (children cost more and contribute less income in cities), more education and paid work for women, wider access to contraception, and lower child mortality, which means parents no longer need many births to see some children reach adulthood.
- Death rate: continues to fall, more slowly.
- Growth: still positive but slowing as the gap narrows.
- Population pyramid: the base begins to narrow.
Stage 4: low stationary
- Birth and death rates: both low, and close to each other.
- Growth: near zero.
- Population pyramid: a column or beehive shape, with similar numbers in each age group until old age. This is called a stationary pyramid.
- Fertility: often near or below replacement level, a total fertility rate of about 2.1 children per woman in low-mortality countries. The extra 0.1 covers children who die before adulthood and the slight excess of male births.
Stage 5: declining (a later addition)
- Birth rate: drops below the death rate, often well below replacement fertility.
- Death rate: may rise slightly even as health improves, because a larger share of the population is old.
- Growth: negative without immigration. The population shrinks and ages.
- Population pyramid: constrictive, narrower at the base than in the middle.
- Examples: Japan, whose population has been falling since roughly 2010, and several countries in southern and eastern Europe.
Summary table
| Stage | Birth rate | Death rate | Natural increase | Pyramid shape |
|---|---|---|---|---|
| 1 High stationary | High | High, fluctuating | Low | Wide base |
| 2 Early expanding | High | Falling fast | High | Expansive |
| 3 Late expanding | Falling | Falling slowly | Slowing | Base narrowing |
| 4 Low stationary | Low | Low | Near zero | Column |
| 5 Declining | Very low | Low or rising | Negative | Constrictive |
A memory aid of our own: deaths drop, then births follow. Stage 2 is the "deaths drop" stage and Stage 3 is the "births follow" stage. If a question asks which rate changes first, the answer is the death rate.
Worked example: growth rates and doubling time
The rule of 70 estimates how long a population takes to double at a steady growth rate:
doubling time (years) ≈ 70 / growth rate (%)
It works because the natural log of 2 is about 0.693, and for small rates the yearly growth factor's log is close to the rate itself.
Country A (Stage 2). CBR = 42, CDR = 14. RNI = (42 − 14) / 10 = 2.8% per year. Doubling time ≈ 70 / 2.8 = 25 years. The exact compound-growth answer, ln 2 / ln 1.028, is about 25.1 years, so the shortcut is very close.
Country B (Stage 4). CBR = 11, CDR = 9. RNI = (11 − 9) / 10 = 0.2% per year. Doubling time ≈ 70 / 0.2 = 350 years. For practical purposes, a stable population.
Country C (Stage 5). CBR = 7, CDR = 11. RNI = (7 − 11) / 10 = −0.4% per year. The population shrinks without immigration. At that rate a population of 10 million would lose about 40,000 people in the first year. Halving time by the same logic is about 70 / 0.4 = 175 years.
Notice that Country C may have better health care than Country A and still have a much higher crude death rate than its birth rate. Its death rate reflects its old age structure, not poor health.
Population momentum
When a Stage 3 country's fertility falls to replacement level, its population usually keeps growing for decades. The reason is population momentum: earlier high fertility left a large cohort of young people, and as they reach childbearing age, even small families add up to many births. Births exceed deaths until that bulge ages. Questions sometimes test this by asking why a country at replacement fertility is still growing.
Connections to other ideas
- Epidemiologic transition: alongside the demographic transition, the main causes of death shift from infectious diseases and malnutrition toward chronic, degenerative diseases such as heart disease and cancer. This is why public health priorities change as countries move through the stages.
- Dependency ratio: the number of children and older adults per 100 working-age people. In Stage 2 it is high because of children. In Stage 5 it rises again because of older adults, which strains pension and health systems.
- Malthusian theory: Thomas Malthus argued that population growth would outrun food supply, leading to famine and higher mortality. The demographic transition describes a different path, in which rising living standards eventually lower fertility on their own.
Limits of the model
- It was built from the history of western Europe and North America, so it describes what happened there, not a law every country must follow.
- Many countries moved through the stages much faster than Europe did, because medicine and sanitation arrived from abroad and cut death rates suddenly.
- It does not include migration, which can dominate population change in some countries.
- Stage 5 was added later, and demographers disagree on whether low fertility is a permanent stage or a phase.
- Policy can change the path, as with government programs that pushed fertility down or tried to raise it.
Common traps
- Saying birth rates fall first. Death rates fall first. The lag creates the growth spurt.
- Putting the fastest growth in Stage 4. Stage 4 growth is near zero. The fastest growth is in Stage 2 and early Stage 3.
- Reading a high crude death rate as poor health care. In aging Stage 5 countries, an older population raises the crude death rate.
- Forgetting to divide by 10. CBR and CDR are per 1,000; RNI is reported as a percent.
- Assuming replacement fertility means zero growth immediately. Population momentum can keep growth going for decades.
- Including migration in natural increase. Natural increase is births minus deaths only.
One-minute recap
- Stage 1: high births, high deaths, slow growth.
- Stage 2: deaths fall first, births stay high, rapid growth, expansive pyramid.
- Stage 3: births fall, growth slows.
- Stage 4: low births and deaths, near-zero growth, column-shaped pyramid.
- Stage 5: births below deaths, aging and shrinking, constrictive pyramid.
- RNI (%) = (CBR − CDR) / 10. Doubling time ≈ 70 / growth %.
- Population momentum keeps growth going after fertility reaches replacement (about 2.1).
Check yourself: 5-question mini-quiz
1. In which stage of the demographic transition does the death rate fall while the birth rate stays high, and what happens to population size?
Stage 2. Mortality drops from better food, sanitation and medicine while fertility stays high, so the population grows rapidly.
2. A country has a crude birth rate of 35 and a crude death rate of 7 per 1,000. What is its rate of natural increase and approximate doubling time?
RNI = (35 − 7) / 10 = 2.8% per year, and doubling time is about 70 / 2.8 = 25 years.
3. Why can a wealthy Stage 5 country have a higher crude death rate than a poorer Stage 3 country?
Its population is much older. The crude death rate is not age-adjusted, so a large share of older adults raises it even when health care is excellent.
4. A country's total fertility rate has just fallen to about 2.1, yet its population keeps growing for decades. What explains this?
Population momentum. Past high fertility left a large cohort of young adults, so births keep exceeding deaths until that cohort ages.
5. What shape of population pyramid matches Stage 5, and why?
A constrictive pyramid, narrower at the base than in the middle, because births have fallen below the level needed to replace the larger older cohorts.